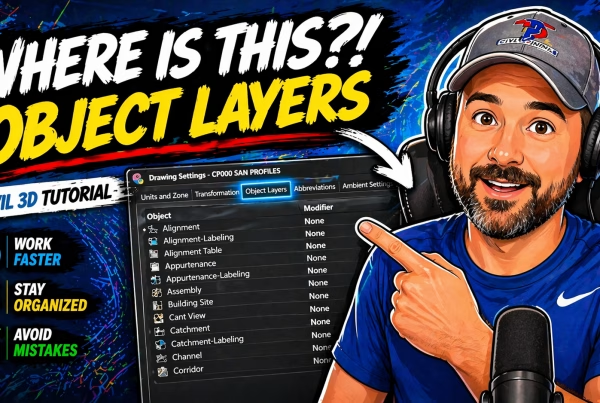
If a proposed design intersects 3D linear elements, it can be very helpful to see those crossings within a profile view. Historically, displaying and annotating profile crossings was challenging. Now, using Civil 3D 2019.2, it is much easier to dynamically view and label crossing elements within a profile view.
Let’s take a look. On my screen is a drawing that represents a portion of a proposed subdivision design. I’m going to zoom in, and we’ll do a quick tour. Right here, I’ve got an existing ground surface called “EG”. Here is a proposed roadway center line alignment called “Tartans Drive”. Over here is another proposed roadway center line alignment called “Willow Lane”. Note that Willow Lane also has a defined finished grade profile. That’s called “Willow Lane FG”.
If I zoom out and pan the drawing over to the west, we can see that the subdivision connects to an existing road, and the geometry of this road is defined by feature lines. We’ll assume that these 3D elements were collected by a surveyor. One more thing. If I back up and pan over, we can see that I have pulled a surface profile for the Tartans Drive alignment.
When designing the finished grade profile for Tartans Drive, it would be very helpful if I could see the Willow Lane crossing and finished grade profile, to ensure my Tartans Drive profile matches the elevation at the intersection. It might also be helpful to show the location of the existing edge of pavement that I will be tying into. To display these items in the profile view, I’ll add them as crossings. I’ll do that by selecting the profile view, and then I’ll expand the launch pad and I’ll choose “add crossings to profile view”.
At this point, Civil 3D is asking me to select objects. Now, I could select as many as I want. For right now, I’m just going to grab this edge of pavement feature line, and I’ll press “enter”. Using this tool, we can display crossing feature lines, survey figures, 3D poly lines, alignments, and profiles.
In the “add crossings” dialog box, we can see the name of the object that was selected. This object will be displayed using a marker style and label style. The elevation of the marker is driven using this menu. By default, it’s set to “use object”, so the marker will be placed at the true 3D elevation of the crossing. I can also set its elevation manually, or I can have that elevation driven by a surface or a profile. Let’s set this back to “use object”. And then rather than shopping off the rack, I’m going to select my own marker style and label style. I’ll click “okay” and “okay”. In case you’re wondering, I’ll show you how to create your own custom marker and label styles in just a little bit.
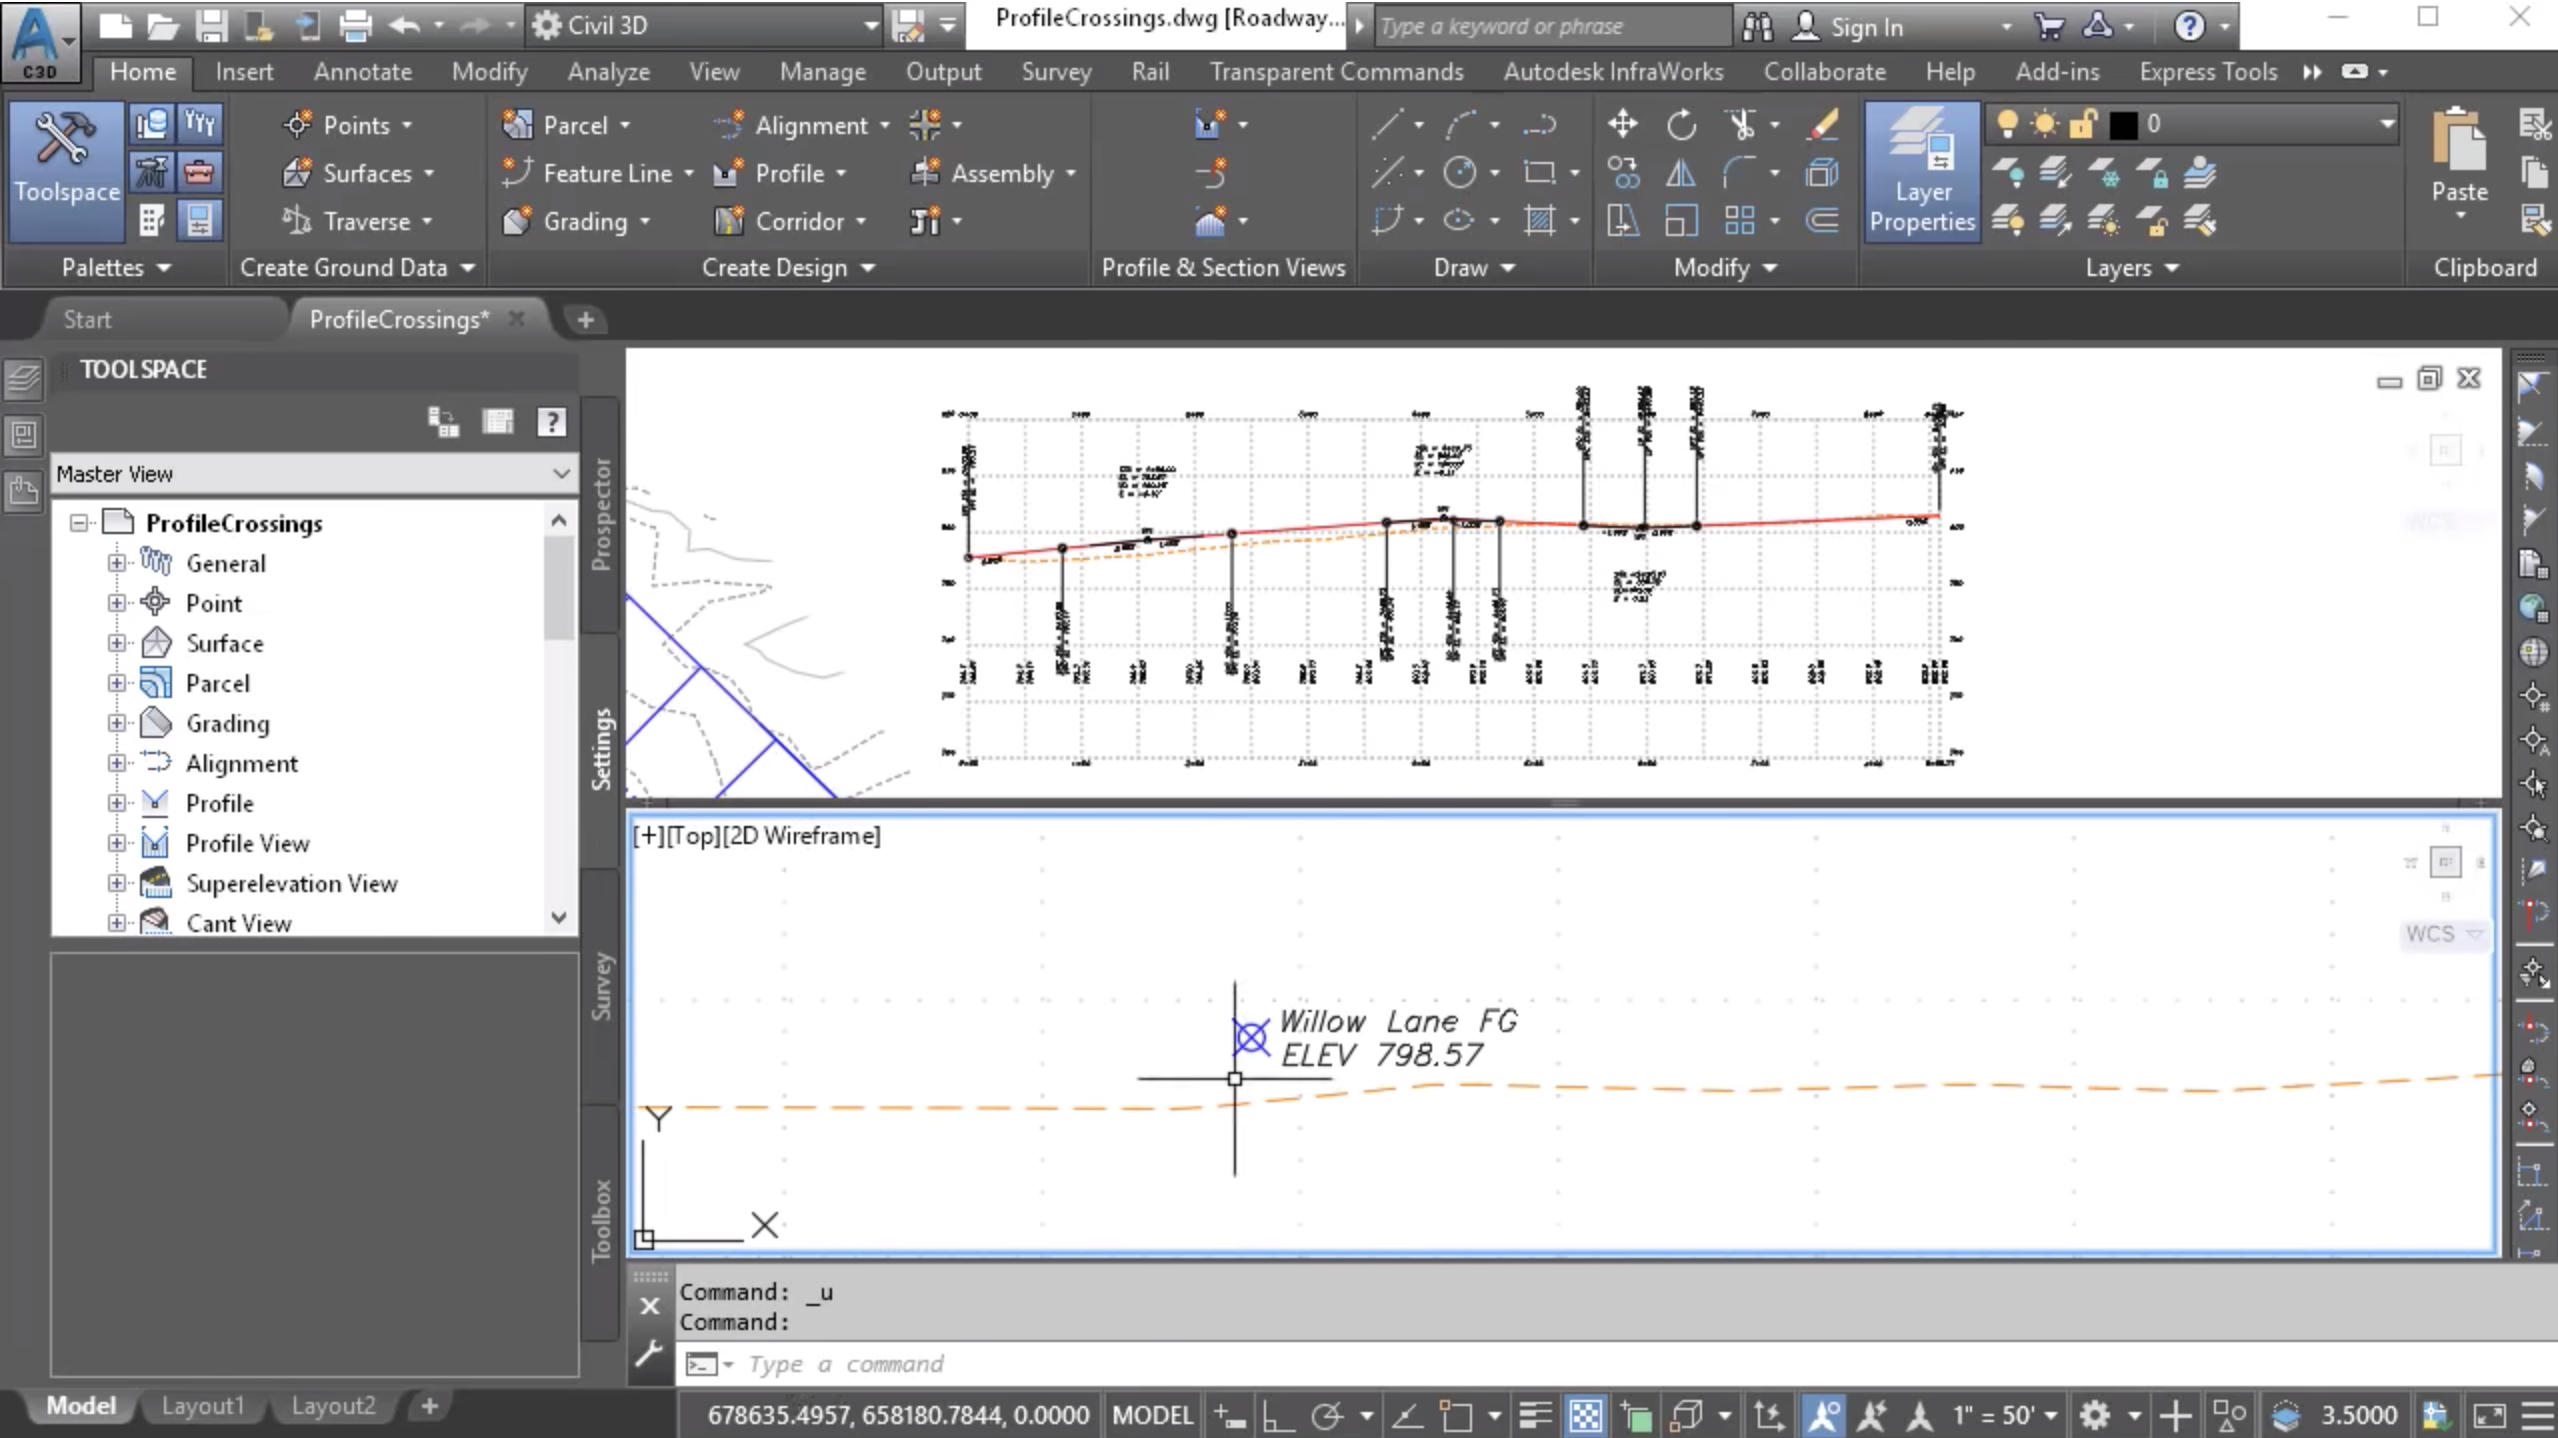
Let’s zoom out, and we’ll pan the drawing up. And right here, we can see the marker that represents the crossing feature line. In fact, if I hover over the marker, you can see how that object highlights in the plan view. Just above, we can see its label.
Let’s zoom out, and we’ll add another crossing object. The profile’s still selected. I’m going to come back to the launch pad, and I’ll choose “add crossings to profile view”. This time I’ll select the Willow Lane alignment, and press “enter”.
Note that when you select an alignment, you also have the ability to display its respective profiles. Each of these objects can be displayed using its own marker and label style. In this case, I don’t wish to see the crossing of the existing ground profile, so I’ll use this toggle to deselect it.
For the finished grade profile, I’ll select my desired marker and label style, and I’ll do the same thing for the alignment. I’m sure you’re aware alignments have no elevation. That said, there is an elevation value in this row. This sets the elevation of the label within the profile view.
When I’m finished assigning styles, I’ll come down and click “okay”. I will then press “escape”, and we’ll zoom in. Since alignments have no elevation, their crossings are displayed as a vertical line. Right here, we can see the label style. If I zoom in a little closer, we can see the marker representing the Willow Lane finished grade profile crossing and its label.
Let’s zoom out. To remove crossing objects from a profile view, I can select the profile view, and then I’ll choose “profile view properties” from the contextual ribbon. Within the profile properties, we’ll find a new crossings tab. This tab will display whenever there are crossing objects in the profile view. Using this tab, I can change the styles of the crossing objects. I can also delete them by clearing these toggles. When finished, I’ll come down and click “okay”, and I’ll press “escape” to deselect.
Now, let’s look at a specific use case. Maybe I would like to display only the alignment crossing in this profile view. To do that, I’ll select the profile view, and then I’ll choose “add crossings”. I’ll select the alignment, and press “enter”. Notice that if I try to remove both of the profiles, I also lose the alignment, and if I select the alignment, I gain both of the profiles.
To remove all profiles from an alignment, right click on each profile name and select “remove”. I can now select my desired object and label style for the crossing alignment. I’ll click “okay” when finished, and we can see the Willow Lane alignment crossing on screen.
Another way we can remove crossing objects from a profile view is to simply select the marker and press the “delete” key. This deletes the marker only, and not the associated linear object.
Let’s look at another use case. Maybe I’d like to display only a crossing profile in a profile view. I’ll select the profile view, and I’ll choose “add crossings”. I’ll select the alignment, and press “enter”. I’d like to view the finished grade profile, so I’m going to deselect “existing ground”. For the finished grade, I’ll select my desired marker and label style. When it comes to the alignment, I’m simply going to set the marker and label style to “none”. When finished, I’ll click “okay”. I’ll press “escape” to deselect.
And if I zoom in, we can see that only the Willow Lane finished grade profile crossing is displayed. It’s important to note that these crossings are dynamic to their respective objects.
Let’s test that. I’m going to restore a viewport configuration. I will then click in this view down below, and we’ll zoom in. Up above, we can see the finished grade profile for Willow Lane. If I select this and change its geometry, we can see how the crossing updates, as well. I’ll press “escape” when finished. To put things back the way they were, I’m going to click in this view down below, and then I will set the viewport configuration to “single”. Having the ability to display linear crossings like these will make it much easier to design the Tartans Drive finished grade profile, because I can easily see the stations and elevations I need to tie into.
Now that we understand how to display crossing objects within a profile view, we are ready to explore some ways to control the appearance of crossing marker and label styles, and we’ll do that in the next session.