
In this session, we’ll look at how to use Civil 3D to calculate a stockpile volume from point cloud data. As you can see, we’re starting out here in ReCap Pro. I’d like to open the point cloud. I’ll do that by clicking the Open button, and then I’m going to navigate into the dataset folder. I’ll jump into this directory called point cloud, rcs, and I’ll select this point cloud called mesh.rcp. Once the point cloud is open in the interface, we’ll talk a little bit about navigating. If I hold the mouse wheel down, I can pan, if I hold the right mouse button down, I can orbit, and if I roll the mouse wheel forward and back, I can zoom in and out.
Now in the interest of full disclosure, I should mention that this point cloud was created from drone imagery that was processed using ReCap Photo. I should also mention that this stockpile is located in Missouri and when this data was processed, it was processed using the Missouri State Plane Coordinate System NAD83, Central Zone, US Foot.
To calculate the volume of this large stockpile, I am first going to separate it from the other points in this dataset. We’ll do that by orbiting this around. We’ll pan it over. I would like to go to a top view. I’ll do that by clicking the top hotspot on the view cube. I will then zoom in. To select the points representing the stock pile, I’m going to come down to the selection area, and I’ll choose Fence. I can then pick points going around the base of this stockpile. I’m going to do this quickly in this case. We can always come back and edit this selection later if we wanted to. I’ll double click when finished. Now that the points are selected, I would like to place them in their own region. I can do that by coming down to the Region area, and I’ll select New Region. We’ll call this region stockpile, and I’ll click okay. You can see the color change on screen. I’m going to press escape to deselect.
Now that I have this region, I can hover here in the lower right corner of the interface. This is the project navigator. In this popup menu, I can click to expand and view the regions in this point cloud. Right here, we can see the stockpile region I just created. Note there’s icons here, we can adjust the color of the display, we can lock the region, we can turn the region on and off, or we could delete the region. I’m more interested in the points that are not part of this region. I’m going to hover over Unassigned Points, and then I’ll click the Hide toggle to hide their display on screen. I will then move my cursor back into the interface.
Now that I’ve isolated these points, I’d like to export them as a brand new point cloud. Let’s go to the Home icon, and from here, I’ll choose Export. I’m going to export this data into the same dataset folder. I’m going to right click, and we’ll create a new directory called point cloud clipped. I will then double click to get into this directory, and I would like to export this point cloud as a unified RCS file. Generally speaking, this means that all the data will be stored within a single file. I’m going to call that file stockpile, and I’ll click Save, and then I’ll click let’s go! to complete the export.
Now that I have a point cloud representing the stockpile, we can close ReCap Photo. I’ll choose not to save the original point cloud, and we’ll jump over to Civil 3D. Here in Civil 3D, I’m in a drawing called stockpile-volume. This is essentially a brand new drawing. I’ve only done one thing, I’ve assigned a coordinate system. If we go to the Settings tab here, I can right click on the drawing name, and we’ll go to Edit Drawing Settings. Right here, you can see I’m using that Missouri State Plane Coordinate System, Central Zone, NAD83, US Foot. Let’s close this.
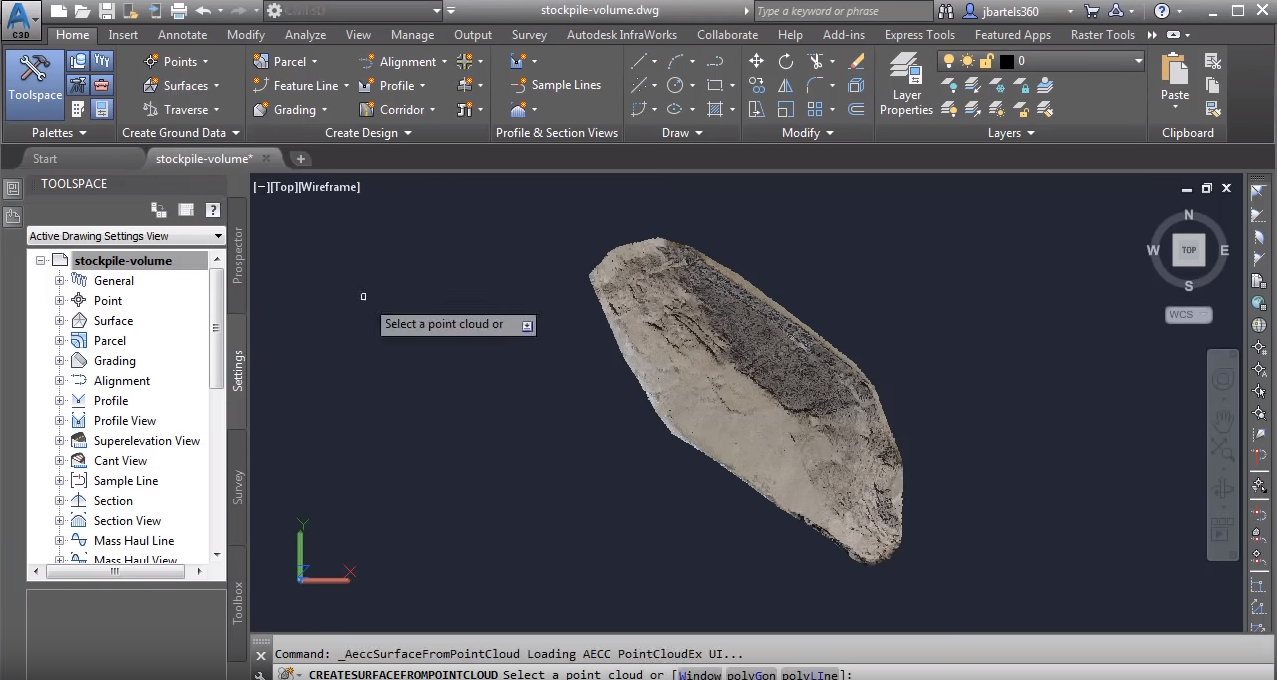
I’d like to insert that point cloud into my Civil 3D environment. We’ll do that by going to the Insert ribbon tab, and then in the Point Cloud panel I’ll choose Attach, and we’ll then jump into the dataset folder. We’ll look inside the point cloud clipped folder, and then I am looking for RCS files. Let’s select stockpile, and I’ll click Open. When this point cloud comes in, I don’t want to make any adjustments to the insertion point, scale, or rotation. I’ll click OK, and we can see the point cloud on screen. Now, here in Civil 3D, if I hold down my shift key and the mouse wheel, I can orbit this point cloud and view it in 3D. When I’m finished viewing that, I’ll click the top hotspot on the view cube to go back to a top view.
At this point, I’d like to build a surface from this point cloud. We’ll do that by going to the Home tab, and then I’ll expand the Surfaces menu, and I’ll choose Create Surface from Point Cloud. I will then select the point cloud, and then I can give my surface a name. I’m going to call it Stockpile. We’ll keep the default style in this case, and I’ll click Next. I can then select how much of the point cloud I’d like to use to build the surface. My default is going to use the entire cloud, although I could build a surface from a selection, or I could use this option to delete the selected areas from this list. In this case, everything’s perfect, let me click Next.
Here, I can assign a filter method to weed out things like trees and cars. You can see there’s a couple filter options available, Planar average and a Kriging interpolation. In this case, I don’t need any filtering, because all of my points represent bare earth. I’ll choose Create Surface, and my surface is now being processed in the background. When it’s finished, I will get a notification. When the surface is complete, I’m going to close this message. We’ll take a look at the surface. To make it a little easier to see, I’m going to hide the point cloud. I’ll do that by coming over to my External Reference manager. I’ll right click on the point cloud, and I’ll choose Unload. I will then select my new surface, and we’ll take a look at it in the object viewer. When this comes up, I can hold the left mouse button down to orbit. You can see the large amount of detail that we have in this surface. When I’ve finished reviewing the surface, I can click the X to close the object viewer, and I’ll press escape to deselect.
At this point, I have the surface representing the top of the stockpile. Now, let’s create a surface representing the bottom. I’ll do that by selecting this surface. We’ll come over to the Properties panel, and I’m going to change its style to Border Only. This gives me a nice three dimensional line string that extends around the base of that surface. Let’s extract this geometry. While the surface is still selected, I’ll choose Extract from Surface, Extract Objects. I’d like to extract that border, and I’ll click OK. I will then press escape. You can see I have a nice, 3D polyline representing the base of that surface.
Now, let’s build a surface from that 3D polyline. We’ll do that by opening the Surfaces menu, and I’ll choose Create Surface. I’m going to call this surface base, and for the style, let’s go with Triangles Only. I’ll click OK, then I’ll click OK. So the surface has been created, I just need to add some data to it. I’ll do that by selecting the Modify ribbon tab. I want to modify a Surface. I want to Add Data. I’m going to add Breaklines. It says, “Which surface to you want to modify?” I’ll tap my space bar to bring up a list. I want to modify the base surface, and I’ll click OK.
I can then name the breakline if I want to. I can adjust some of these other properties. I’m just going to keep the defaults, and I’ll click OK. It says, “Okay, what breaklines do you want to add?” I’m going to create a crossing window across that 3D polyline, and I’ll press enter. This base surface represents the bottom of the stockpile. I’m going to select it. We’ll take a look at it in the object viewer. I will then close this, and I’ll press escape.
Now that we have a pair of surfaces, we can calculate the volume between them. We’ll do that by going to the Analyze ribbon tab, and I’ll come down and choose Volumes Dashboard. From here, I will click to Create a new volume surface. A volume surface is a surface whose elevations are based on the difference between two selected surfaces. We’ll call this surface volume, and then for the style, I don’t need to see this surface, so we’ll make it No Display, and I’ll click OK. For the base surface, I’ll select that surface we created called base. For the comparison surface, I’ll select the Stockpile surface, and I’ll click OK. I’m not going to make any adjustments to the Cut or Fill Factors, I’m just going to click OK.
Civil 3D will then calculate the volume by sampling the hundreds of thousands of points that make up these surfaces. When it’s finished, I can see the volume is just over 36,000 cubic yards of fill. Let’s close the panorama, and I’m going to turn the Stockpile surface back on. I’ll do that by going to the Prospector tab, and then we will right click on that Stockpile surface. I’ll choose select, and in the Properties palette, we’ll flip this back to Existing 1 And 5, then I’ll press escape. If I zoom in and hover, we can see the elevation of both the Stockpile and the base surface. Notice that we can also see the elevation of the volume surface. This can be a great way to measure the height of the stockpile. If I hover here, at approximately the highest location, I can see that stockpile is a little over 57 feet high. When I’m finished reviewing the data, we’ll back up and center this on screen.
So, if your workflow requires you to calculate material volumes of large stockpiles, consider using point cloud data in conjunction with Civil 3D. Capturing stockpiles as point clouds can be the fastest and safest means of collecting this data, while also providing much more detail than what is obtainable using more traditional collection methods.